Here is a brief overview of documentation project, doxygen tags and diagrams specification which were used to create this documentation.
I. Documentation solution and files.
The documentation is built not for the MapWinGIS source but for C# interop assemblies. It's possible to provide more friendly C# syntax in such way (rather then C++) and use the same solution to generate Visual Studio Intellisense file.
The solution consists of 3 projects:
- Interop.MapWinGIS (holds definitions of COM interfaces);
- AxInterop.MapWinGIS (holds definition of AxMap control);
- Examples (the files with C# examples and small WinForms application to test them).
The following switch is used to provide the desired names for documentation and Intellisense file.
#if nsp
namespace MapWinGIS {
#endif
#if nsp
public class IShapefile
#else
#endif
Provides a functionality for accessing and editing ESRI shapefiles.
Definition: Shapefile.cs:72
For documentation we shall get Shapefile, for Intellisense - MapWinGIS.IShapefile (nsp is defined in Project Build symbols)
The Doxygen setings are stored in the "MapWinGIS doxyfile" file in the root folder of the solution. Also there are several files that override default style settings: DoxygenLayout.xml, header.html, doxygen.css.
II. How to add new members.
To add the new members to the documentation after they were added to MapWinGIS it's necessary:
1. Rebuild Interop assemblies;
2. Add new members to the appropriate interface.
The most convenient way is to change the following line:
to the line:
Then to choose "Implement interface IShapefile" from the smart tag and to revert the changes back.
3. Add C# documentation comments and doxygen tags.
4. Generate the new html documentation by Doxygen.
To run Doxygen generation process:
- run Doxywizard.exe;
- open the file "MapWinGIS doxyfile" in the root folder of the solution;
- click "Run doxygen" button on the "Run" tab.
The new documentation will be placed into "ouput" folder inside solution.
III. New Examples.
Some guidelines on how to add a new example on the Examples page.
- Each new example must be placed in separate .cs file in "Examples\src" folder or its subfolders.
- The file must add some public function to MapExamples partial class.
- It should be registered in the application (see "Examples\Description.cs").
- A file "examples_list.cs" with necessary definitions will be automatically generated in "Interop.MapWinGIS\Related pages\"
folder on the running of the project.\n\n
5. It's possible to create a screenshot with the results of the example by clicking Snapshot button in the application.
The screenshot will be added to the documentation automatically.
@section doxygen_tags IV. Doxygen tags.
All the tags must be placed as C# comments (3 slashes) before the declaration of the member. The declaration of the
<a href="pages.html">Related pages</a> and <a href = "examples.html">Examples</a> can be placed in any part of the .cs files.\n\n
Here is list of useful Doxygen tags:
\include doxygen_tags.txt
<a href = "http://www.stack.nl/~dimitri/doxygen/manual.html">Doxygen manual</a>\n\n
The path for external files (the files should be placed in either that or any nested folder):
@code
Resources\graphs\
Resources\images\
Examples\src\
\endcode
Doxygen will automatically place links for the API members in case their full name is typed: AxMap. Use "%" sign
to prevent this behavior: %AxMap \n\n
Cross references in the examples are placed automatically as well. The only precondition - the correct declaration of
variable type (either local or parameter). MapWinGIS namespace must not be used, i.e. Shapefile but not MapWinGIS.Shapefile.\n
@section dot_tags V. Graphs definition.
Graphs a generated using <a href = "http://www.stack.nl/~dimitri/doxygen/diagrams.html">Graphviz tool.
They can be either:
- inlined in code between \dot \enddot commands;
- defined in external file.
Graph definition consists of several parts:
- general settings;
- node settings;
- list of nodes;
- edges settings;
- list of edges.
The settings for nodes and edges can be:
- global (node and edge tags) which are used for all the following lines;
- local which are used for a single node or edge and override global settings.
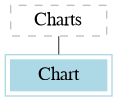
Here is a small example to give the general idea about the structure. See details in the description of Dot tool in Graphviz documentation.
digraph graph_name
{
nodesep = 0.3;
ranksep = 0.2;
splines = ortho;
node [shape= "polygon", peripheries = 2, color = lightblue, style = filled, height = 0.3, width = 1.0];
lb [ label="Chart" URL="\ref Chart"];
lbs [ label="Charts" URL="\ref Charts" color = gray, style = dashed, peripheries = 1];
edge [ arrowhead="open", fontsize = 9, fontcolor = blue, color = "#606060", dir = "none" ]
lbs -> lb [ URL="\ref Charts.get_Chart()"];
}
The output will be the following: