

Represents a single chart on the map. More...
Properties | |
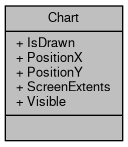
| bool | IsDrawn [get, set] |
| Returns a boolean value which indicates whether the chart is currently displayed on the map. More... | |
| double | PositionX [get, set] |
| Gets or set the horizontal position of chart in map units. More... | |
| double | PositionY [get, set] |
| Gets or sets the vertical position of the chart in map units. More... | |
| Extents | ScreenExtents [get] |
| Returns the rectangle which the chart occupies on the screen. More... | |
| bool | Visible [get, set] |
| Gets or sets the value which indicates whether the chart should be drawn on the map. More... | |
Represents a single chart on the map.
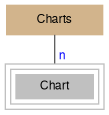
The number of bars or sectors depends on the number of charts fields specified in the instance of the Charts class it belongs to. In the same way the visualization options depends in the corresponding settings of the Charts class. Each chart borrows it's data from attribute table of shapefile (see Table). So the only way to change the height of individual bars is to modify the values in the underlying .dbf table.
This class isn't meant for creation of the new charts but only for modification of position and visibility of the existing ones. Initially charts are generated by using Charts.Generate() method. Afterwards to access a single chart Charts.get_Chart() property can be used.
|
getset |
Returns a boolean value which indicates whether the chart is currently displayed on the map.
Chart can be left undrawn because of the following reasons:
|
getset |
Gets or set the horizontal position of chart in map units.
|
getset |
Gets or sets the vertical position of the chart in map units.
|
get |
Returns the rectangle which the chart occupies on the screen.
This property will return NULL in case Chart.IsDrawn returns false.
|
getset |
Gets or sets the value which indicates whether the chart should be drawn on the map.
Setting this property to true doesn't mean that it actually will be displayed on the map (see Chart.IsDrawn).