|
| bool | AddField (ChartField Field) |
| | Adds a field to the chart. More...
|
| |
| void | AddField2 (int FieldIndex, uint Color) |
| | Adds a field to the chart. More...
|
| |
| void | Clear () |
| | Clears the information about individual charts like position and visibility. More...
|
| |
| void | ClearFields () |
| | Removes all fields which define bars or sectors of the chart. More...
|
| |
| void | Deserialize (string newVal) |
| | Restores the state of the charts from the serialized string. More...
|
| |
| bool | DrawChart (IntPtr hdc, float x, float y, bool hideLabels, uint BackColor) |
| | Draws a chart on the specified device context. Can be used for displaying of map legend. More...
|
| |
| bool | Generate (tkLabelPositioning Type) |
| | Generates a chart for every shape of the parent shapefile. More...
|
| |
| Chart | get_Chart (int Chart) |
| | Gets a reference to the chart with the specified index. More...
|
| |
| string | get_ErrorMsg (int ErrorCode) |
| | Gets the description of the specified error code. More...
|
| |
| ChartField | get_Field (int FieldIndex) |
| | Gets a reference to the field of the chart with the specified index. More...
|
| |
| bool | InsertField (int Index, ChartField Field) |
| | Inserts a field which represents single bar or sector of the chart. More...
|
| |
| bool | InsertField2 (int Index, int FieldIndex, uint Color) |
| | Inserts a field which represents single bar or sector of the chart. More...
|
| |
| bool | LoadFromXML (string Filename) |
| | Loads charts data from the XML file generated by Charts.SaveToXML. More...
|
| |
| bool | MoveField (int OldIndex, int NewIndex) |
| | Changes the position of a field (bar or sector) in the list which affects the order of drawing. More...
|
| |
| bool | RemoveField (int Index) |
| | Removes the field which corresponds to the bar or the sector of the chart. More...
|
| |
| bool | SaveToXML (string Filename) |
| | Saves the state of the charts to the XML file. More...
|
| |
| bool | Select (Extents BoundingBox, int Tolerance, SelectMode SelectMode, ref object Indices) |
| | Returns the indices of charts which are displayed within specified rectangle on the screen. More...
|
| |
| string | Serialize () |
| | Serializes the state of the charts to the string. More...
|
| |
|
| bool | AvoidCollisions [get, set] |
| | Gets or set a boolean value which indicates whether charts can overlap each other. More...
|
| |
| int | BarHeight [get, set] |
| | Gets or sets the maximum height of the bar chart in pixels. More...
|
| |
| int | BarWidth [get, set] |
| | Gets or sets the width of a single bar of the chart in pixels. More...
|
| |
| string | Caption [get, set] |
| | Gets or sets the text string for description of the chart data. More...
|
| |
| tkChartType | ChartType [get, set] |
| | Gets or sets the type of the charts. More...
|
| |
| int | CollisionBuffer [get, set] |
| | Gets or sets the minimal distance between individual charts when Charts.AvoidCollisions is set to true. More...
|
| |
| int | Count [get] |
| | Returns the number of charts which is equal to the number of shapes in the parent shapefile. More...
|
| |
| bool | DynamicVisibility [get, set] |
| | Gets or sets a value which indicates whether charts will be visible for all scales or in the given range of scales only. More...
|
| |
| ICallback | GlobalCallback [get, set] |
| | Gets or sets a callback object to display progress and error information. More...
|
| |
| int | IconHeight [get] |
| | Gets the minimal height of the image to display a single chart. More...
|
| |
| int | IconWidth [get] |
| | Gets the minimal width of the image to display a single chart. More...
|
| |
| string | Key [get, set] |
| | Gets or sets a string value associated with the object. More...
|
| |
| int | LastErrorCode [get] |
| | Gets the code of the last error which took place inside the current instance of the class. More...
|
| |
| uint | LineColor [get, set] |
| | Gets or sets the color of the chart outline More...
|
| |
| double | MaxVisibleScale [get, set] |
| | Get or sets the maximum scale the charts are displayed when dynamic visibility is turned on. More...
|
| |
| double | MinVisibleScale [get, set] |
| | Gets or sets the minimal scale the charts are displayed when dynamic visibility is turned on. More...
|
| |
| int | NormalizationField [get, set] |
| | Gets or sets the index of field upon which the values of other fields will be divided before displaying charts. More...
|
| |
| int | NumFields [get] |
| | Gets the number of fields which correspond to the bars of sectors depending on chart type. More...
|
| |
| int | OffsetX [get, set] |
| | Gets or sets the horizontal offset for drawing charts. More...
|
| |
| int | OffsetY [get, set] |
| | Gets or set the vertical offset for drawing charts. More...
|
| |
| int | PieRadius [get, set] |
| | Gets or sets the radius of the pie chart in pixels. More...
|
| |
| int | PieRadius2 [get, set] |
| | Gets or sets the radius of the largest chart when Charts.UseVariableRadius is turned on. More...
|
| |
| double | PieRotation [get, set] |
| | Gets or set the rotation of the pie chart. More...
|
| |
| tkSavingMode | SavingMode [get, set] |
| | Gets or sets the mode for serialization of charts. Affects Charts.SaveToXML method. More...
|
| |
| int | SizeField [get, set] |
| | Gets or sets the index of field which affect the radius of charts when Charts.UseVariableRadius is set to true. More...
|
| |
| double | Thickness [get, set] |
| | Gets or sets the value which affects 3D display of the charts. More...
|
| |
| double | Tilt [get, set] |
| | Gets or sets the tilt of the charts when 3D display is on. More...
|
| |
| short | Transparency [get, set] |
| | Gets or set the transparency of charts (0-255). More...
|
| |
| bool | Use3DMode [get, set] |
| | Gets or sets a boolean value which indicates whether 3D mode will be used for charts drawing. More...
|
| |
| bool | UseVariableRadius [get, set] |
| | Gets or sets the value which indicates whether all pie charts will have the same or varying radius. More...
|
| |
| bool | ValuesFontBold [get, set] |
| | Gets or sets the value which indicates whether data labels for charts will be bold. More...
|
| |
| uint | ValuesFontColor [get, set] |
| | Gets or sets the colour of the chart's data labels. More...
|
| |
| bool | ValuesFontItalic [get, set] |
| | Gets or sets the value which indicates whether data labels for charts will be italic. More...
|
| |
| string | ValuesFontName [get, set] |
| | Gets or sets the font name for data labels of charts. The names of font families like "Arial" can be used. More...
|
| |
| int | ValuesFontSize [get, set] |
| | Gets or set the size of chart's labels. More...
|
| |
| uint | ValuesFrameColor [get, set] |
| | Gets or sets the colour of the frame for chart labels. More...
|
| |
| bool | ValuesFrameVisible [get, set] |
| | Gets or sets a boolean value which indicates whether the frame of chart's labels is visible. More...
|
| |
| tkChartValuesStyle | ValuesStyle [get, set] |
| | Gets or sets the style of the chart's labels. More...
|
| |
| bool | ValuesVisible [get, set] |
| | Gets or sets the value which indicates whether labels with values of the fields will be drawn near each chart. More...
|
| |
| tkVerticalPosition | VerticalPosition [get, set] |
| | Gets or sets the position of charts in the map drawing order. More...
|
| |
| string | VisibilityExpression [get, set] |
| | Gets or sets the expression which defines the subset of charts which will be displayed on the map. More...
|
| |
| bool | Visible [get, set] |
| | Turns on or off the visibility of charts. More...
|
| |
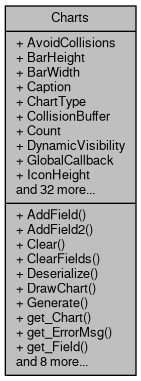
Provides functionality for generation and managing the charts on the map.
Graph description
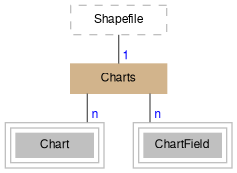
The charts obtain their data from the fields of attribute table of the shapefile. A single bar or sector of the chart is mapped to a certain field by means of ChartField class. The number of fields to be displayed can be changed by Charts.AddField, Charts.RemoveField. The fields should be of numeric types, either double or integer.
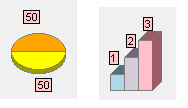
Two types of charts are available:
- Pie charts:
- are suitable when it's necessary to display the parts of the whole phenomenon, like the percentage of land use by type (urban, forest, agricultural, etc.);
- it's possible to set varying width for the charts depending of the certain field, which can give an idea about the values for different shapes on comparative scale;
- Bar charts:
- they can be used to display virtually any numeric data;
- it still makes sense to display fields with the same units of measure;
To generate charts one basically needs:
- To specify a set of fields which will be included (see Charts.AddField and Charts.AddField2).
- To define the positions of the charts relative to the parent shape.
- Charts.Generate method is the only one to do this job;
- for large shapefile this procedure can be time consuming, therefore there are means for caching this data to avoid additional recalculations;
- it's possible to change the generated positions of the individual charts (see Chart.PositionX, Chart.PositionY).
- To set the display options of the charts. The options include:
- the size of charts (Charts.PieRadius for pie charts and Charts.BarHeight for bar charts; the values of these 2 types of charts don't affect each other);
- the colour of the charts fill and outline;
- labels with the values from the underlying table, which correspond to particular bar or sector.
{
}
tkLabelPositioning
The available positioning of the label relative to the parent shape.
Definition: Enumerations.cs:835
tkChartType
The available types of chart.
Definition: Enumerations.cs:200
void AddField2(int FieldIndex, uint Color)
Adds a field to the chart.
Definition: Charts.cs:118
bool Generate(tkLabelPositioning Type)
Generates a chart for every shape of the parent shapefile.
Definition: Charts.cs:255
tkChartType ChartType
Gets or sets the type of the charts.
Definition: Charts.cs:171
Provides a functionality for accessing and editing ESRI shapefiles.
Definition: Shapefile.cs:72
Charts Charts
Gets or sets an instance of Charts class associated with the shapefile.
Definition: Shapefile.cs:195
Individual charts can be accessed using Charts.get_Chart() property. It's possible to change their properties like visibility or position. Chart.ScreenExtents property return screen coordinates occupied by particular chart which provides a convenient way for highlighting or mouse dragging operation on the chart.
By default charts are drawn for each shape of the shapefile, but if only a subset of shapes require charts it's possible to set Charts.VisibilityExpression, or toggle the visibility of individual charts (Chart.Visible). Though the number of individual charts will always be equal to the number of shapes in the shapefile, which means that charts will be automatically added and removed after corresponding editing operation in the parent shapefile. It's not possible to set different visualization options or the number of fields for individual charts.
It's not possible to use charts independently of the shapefile layer. But it's possible to create a dummy shapefile, populate it with data and display any charts at any location.
- New API 4.8:
- Added in version 4.8
- Examples
- Segmentation.cs.