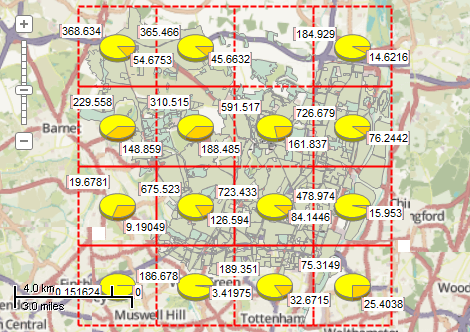
This example demonstrates how to do a segmentation of layers by regular grid, to calculate the percentage of land usage for each cell and to show it as pie charts. The combined extents of 2 polygon shapefiles are split by regular grid with 4 by 4 cells, which is represented by polygon shapefile. An intersection for each cell of grid and each input shapefile is calculated.To visualize the relative area of polygons obtained by intersection a temporary shapefile with charts is created. Each chart denote the percentage of area covered by one of the input shapefiles in the given cell. Note: the grid mentioned in this example has nothing to do with Grid class provided by MapWinGIS. The displayed areas are represented in hectares. Here is a screenshot with the results of the code execution.
using System.Collections.Generic;
using System.IO;
using System.Windows.Forms;
using AxMapWinGIS;
using MapWinGIS;
using System.Diagnostics;
namespace Examples
{
public partial class MapExamples
{
public void Segmentation(
AxMap axMap1,
string dataPath)
{
string[] filenames = new string[2];
filenames[0] = dataPath + "natural.shp";
filenames[1] = dataPath + "landuse.shp";
if (!File.Exists(filenames[0]) || !File.Exists(filenames[1]))
{
MessageBox.Show("Couldn't file the files (natural.shp, landuse.shp): " + dataPath);
return;
}
List<Shapefile> layers = new List<Shapefile>();
for (int i = 0; i < filenames.Length; i++)
{
sf.
Open(filenames[i],
null);
layers.Add(sf);
}
int count = 4;
double xStep = (ext.
xMax - ext.
xMin)/count;
double yStep = (ext.
yMax - ext.
yMin)/count;
for (int i = 0; i < layers.Count; i++)
{
string name = Path.GetFileNameWithoutExtension(layers[i].Filename);
uint color = scheme.GraduatedColor[(i + 1) / (double)layers.Count];
}
for (int i = 0; i < count; i++)
{
for (int j = 0; j < count; j++)
{
for (int layer = 0; layer < layers.Count; layer++)
{
double area = 0.0;
{
Shape shp2 = sf.Shape[n];
{
if (shpResult != null)
{
}
}
}
bool success = sfGrid.
EditCellValue(layer + 1, shapeIndex, area/10000.0);
}
}
}
}
}
}
tkLabelPositioning
The available positioning of the label relative to the parent shape.
Definition: Enumerations.cs:835
tkMapColor
A list of named constants for some of the well-known colors.
Definition: Enumerations.cs:951
tkDashStyle
The available style of lines. Can be used for drawing polylines and outlines of the polygons.
Definition: Enumerations.cs:442
tkChartType
The available types of chart.
Definition: Enumerations.cs:200
ShpfileType
The type of the shapefile.
Definition: Enumerations.cs:169
FieldType
The available types of fields of dbf table.
Definition: Enumerations.cs:34
tkClipOperation
The available clipping operation for Shape.Clip method.
Definition: Enumerations.cs:269
tkMapProjection
Commonly used map projections to be set in Form Designer (see AxMap.Projection property).
Definition: Enumerations.cs:1741
Map component for visualization of vector, raster or grid data.
Definition: AxMap.cs:56
Provides functionality for generation and managing the charts on the map.
Definition: Charts.cs:100
int PieRadius
Gets or sets the radius of the pie chart in pixels.
Definition: Charts.cs:423
void AddField2(int FieldIndex, uint Color)
Adds a field to the chart.
Definition: Charts.cs:118
bool Generate(tkLabelPositioning Type)
Generates a chart for every shape of the parent shapefile.
Definition: Charts.cs:255
double Thickness
Gets or sets the value which affects 3D display of the charts.
Definition: Charts.cs:515
tkChartType ChartType
Gets or sets the type of the charts.
Definition: Charts.cs:171
bool Visible
Turns on or off the visibility of charts.
Definition: Charts.cs:662
bool ValuesVisible
Gets or sets the value which indicates whether labels with values of the fields will be drawn near ea...
Definition: Charts.cs:635
Provides methods for random colour generation and colour interpolation based on the specific set of c...
Definition: ColorScheme.cs:65
void SetColors2(tkMapColor Color1, tkMapColor Color2)
Clears all the existing breaks and creates 2 breaks with the specified colours.
Definition: ColorScheme.cs:156
Represents a rectangle on the map.
Definition: Extents.cs:49
double xMax
The maximum x bound for the extents object.
Definition: Extents.cs:121
double yMax
The maximum y bound for the extents object.
Definition: Extents.cs:137
double xMin
Gets the minimum x bound for the extents object.
Definition: Extents.cs:129
double yMin
Gets the minimum y bound for the extents object
Definition: Extents.cs:145
Holds information about coordinate system and projection of the data.
Definition: GeoProjection.cs:98
bool CopyFrom(GeoProjection sourceProj)
Copies information from another GeoProjection object.
Definition: GeoProjection.cs:105
Holds the set of options for visualization of shapefiles.
Definition: ShapeDrawingOptions.cs:239
float LineWidth
Gets or sets the width of the lines to draw shapes.
Definition: ShapeDrawingOptions.cs:624
uint LineColor
Gets or sets the line color of the shapes.
Definition: ShapeDrawingOptions.cs:577
tkDashStyle LineStipple
Gets or sets the line style of the shapes.
Definition: ShapeDrawingOptions.cs:596
bool FillVisible
Gets or sets the value which indicates whether the fill is visible.
Definition: ShapeDrawingOptions.cs:549
A shape object represents a geometric shape which can be added to a shapefile which is displayed in t...
Definition: Shape.cs:41
int AddPoint(double x, double y)
Adds a point to the shape.
Definition: Shape.cs:700
Shape Clip(Shape shape, tkClipOperation operation)
Performs clipping operation with 2 shapes.
Definition: Shape.cs:111
double Area
Calculates the area of the shape. For non-polygon shapes this property will return 0....
Definition: Shape.cs:50
bool Intersects(Shape shape)
Tests an "intersects" relation between 2 shapes.
Definition: Shape.cs:396
bool Create(ShpfileType shpType)
Creates a new shape of the specified type.
Definition: Shape.cs:154
Provides a functionality for accessing and editing ESRI shapefiles.
Definition: Shapefile.cs:72
Charts Charts
Gets or sets an instance of Charts class associated with the shapefile.
Definition: Shapefile.cs:195
GeoProjection GeoProjection
Get or sets an instance of GeoProjection class associated with the shapefile.
Definition: Shapefile.cs:206
int NumShapes
Gets the number of shapes in the shapefile.
Definition: Shapefile.cs:254
ShapeDrawingOptions DefaultDrawingOptions
Gets or sets an instance of ShapeDrawingOptions class which holds default drawing options.
Definition: Shapefile.cs:111
tkMapProjection Projection
Sets projection of the map. It providers 2 most commonly used coordinate system/projections to be eas...
Definition: AxMap.cs:2709
bool GrabProjectionFromData
Gets or sets a value indicating whether projection for will be taken from the first datasource added ...
Definition: AxMap.cs:2701
Extents MaxExtents
Gets or sets the extents of the map displayed by the control.
Definition: AxMap.cs:2435
void ZoomToMaxExtents()
Zooms the map to the maximum extents of all loaded layers.
Definition: AxMap.cs:652
int AddLayer(object Object, bool visible)
Adds a layer to the map.
Definition: AxMap.cs:1342
int EditAddShape(Shape shape)
Adds a new shape to the shapefile.
Definition: Shapefile.cs:863
bool CreateNewWithShapeID(string shapefileName, ShpfileType shapefileType)
Initializes in-memory shapefile of the specified type with unique index field.
Definition: Shapefile.cs:1416
bool Open(string shapefileName, ICallback cBack)
Opens shapefile from the disk.
Definition: Shapefile.cs:1430
int EditAddField(string name, FieldType type, int precision, int width)
Adds a field to the attribute table of the shapefile. The table must be in editing mode.
Definition: Shapefile.cs:708
bool EditCellValue(int fieldIndex, int shapeIndex, object newVal)
Sets the new value for particular cell in attribute table. The table must be in editing mode.
Definition: Shapefile.cs:633